Interest Rates — Distinguishing "Cyclical" Moves From "Secular" Trends
The long-term trend in interest rates appears to be higher. But, there's a short-term cycle that moves within the rates.

Let's look at some charts to illustrate.
Here's a chart of interest rates throughout 2023, specifically the 10-year Treasury yield.
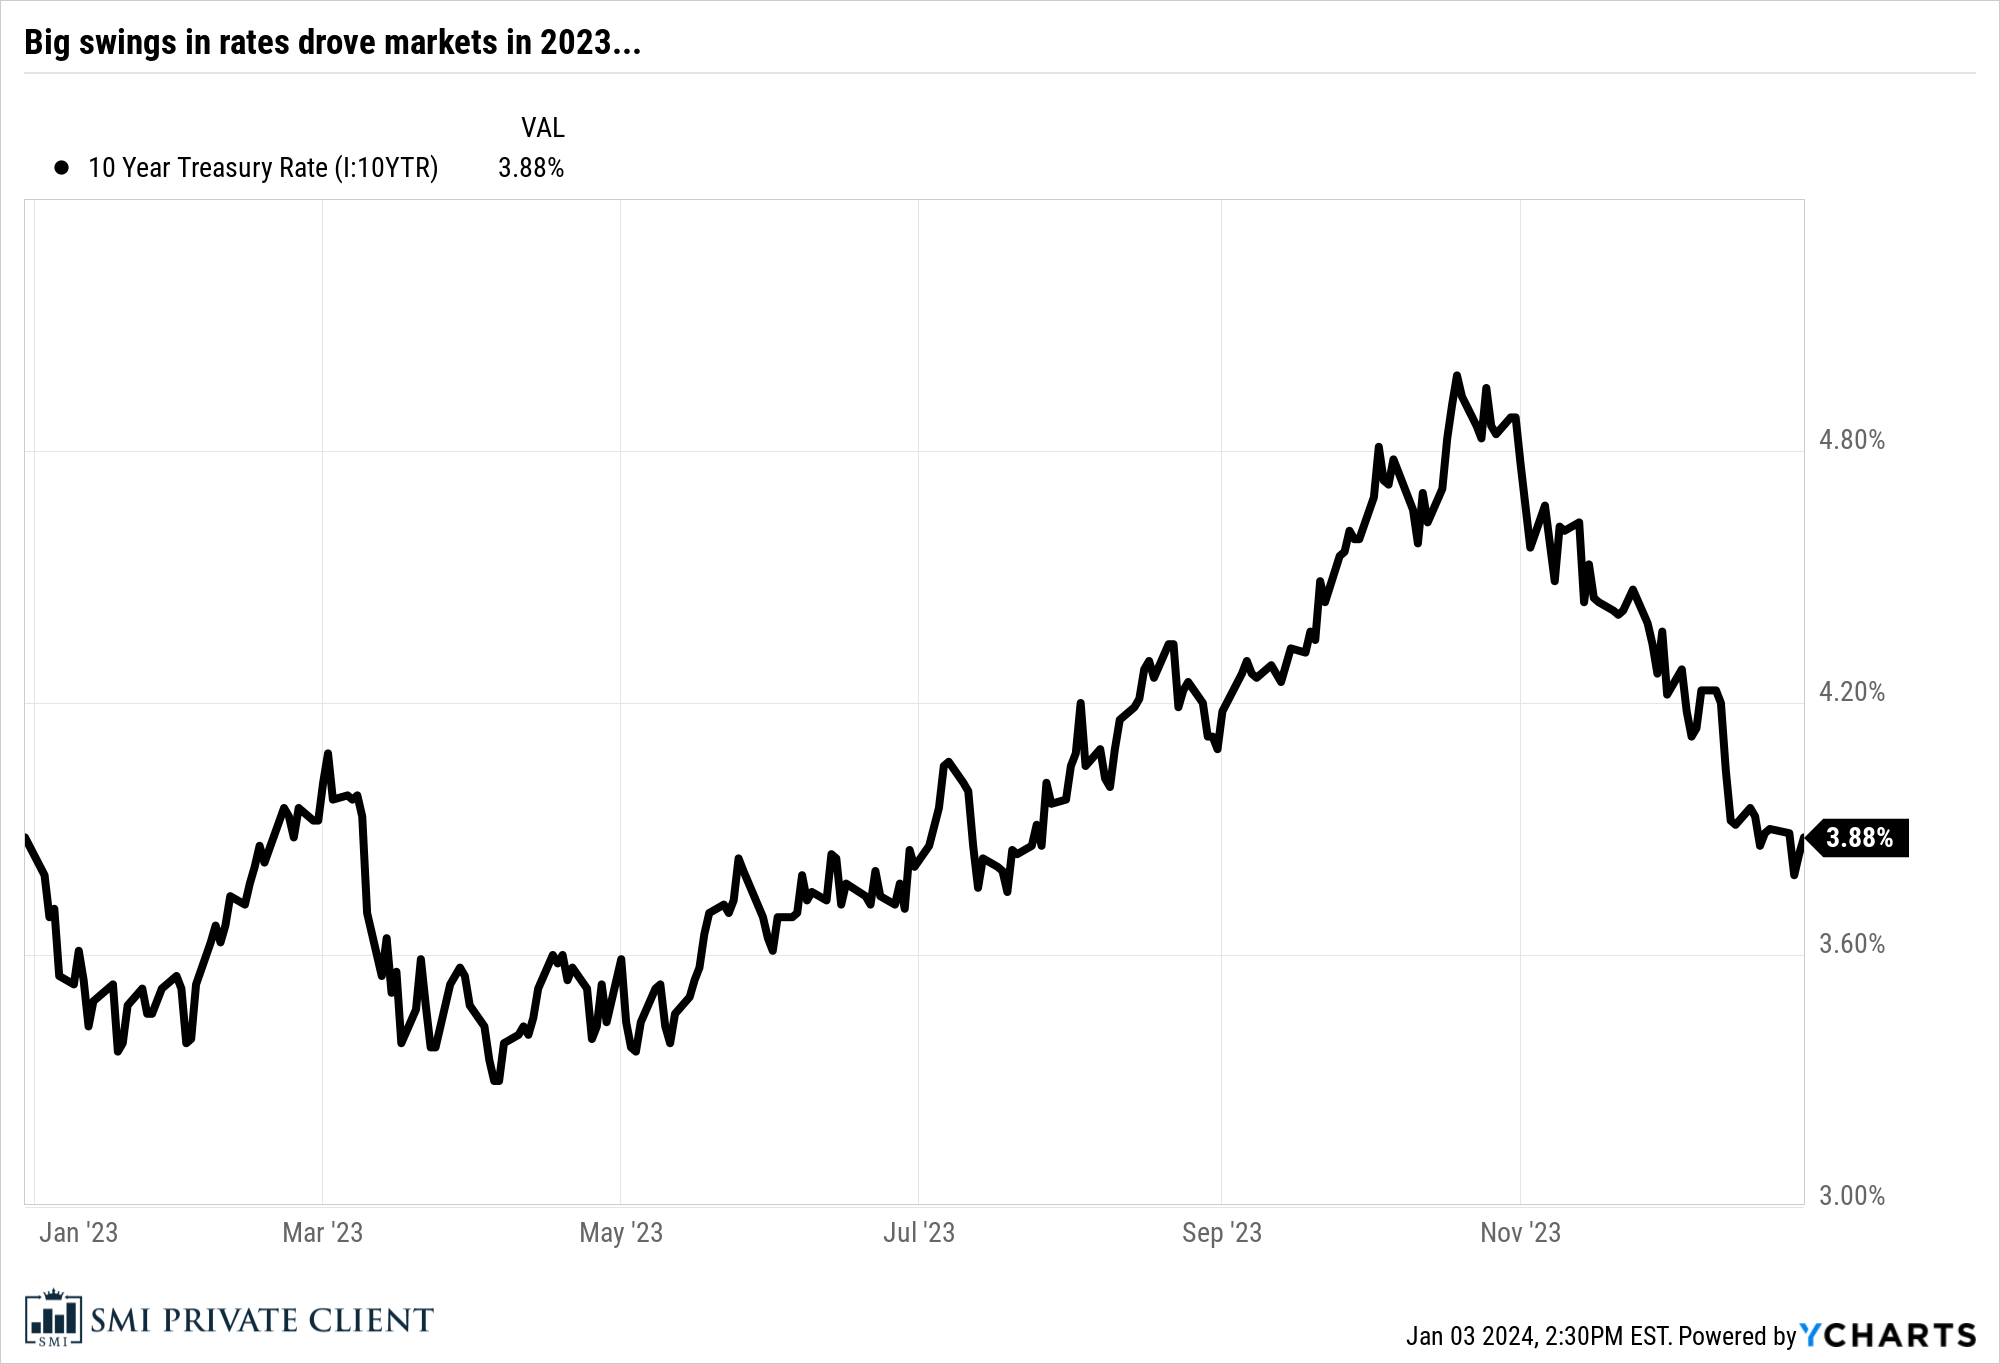 We can clearly see in this chart how yields had strong moves in both directions last year. Those strong moves were often the primary drivers of the stock market's direction. For example, stocks tanked from August-October as yields climbed toward 5%. Then stocks reversed course and soared as rates declined sharply during November-December. These were cyclical moves, primarily based on investor reactions to the changing odds of a recession.
Now let's pull back and look at a longer-term chart of the same 10-year Treasury yield.
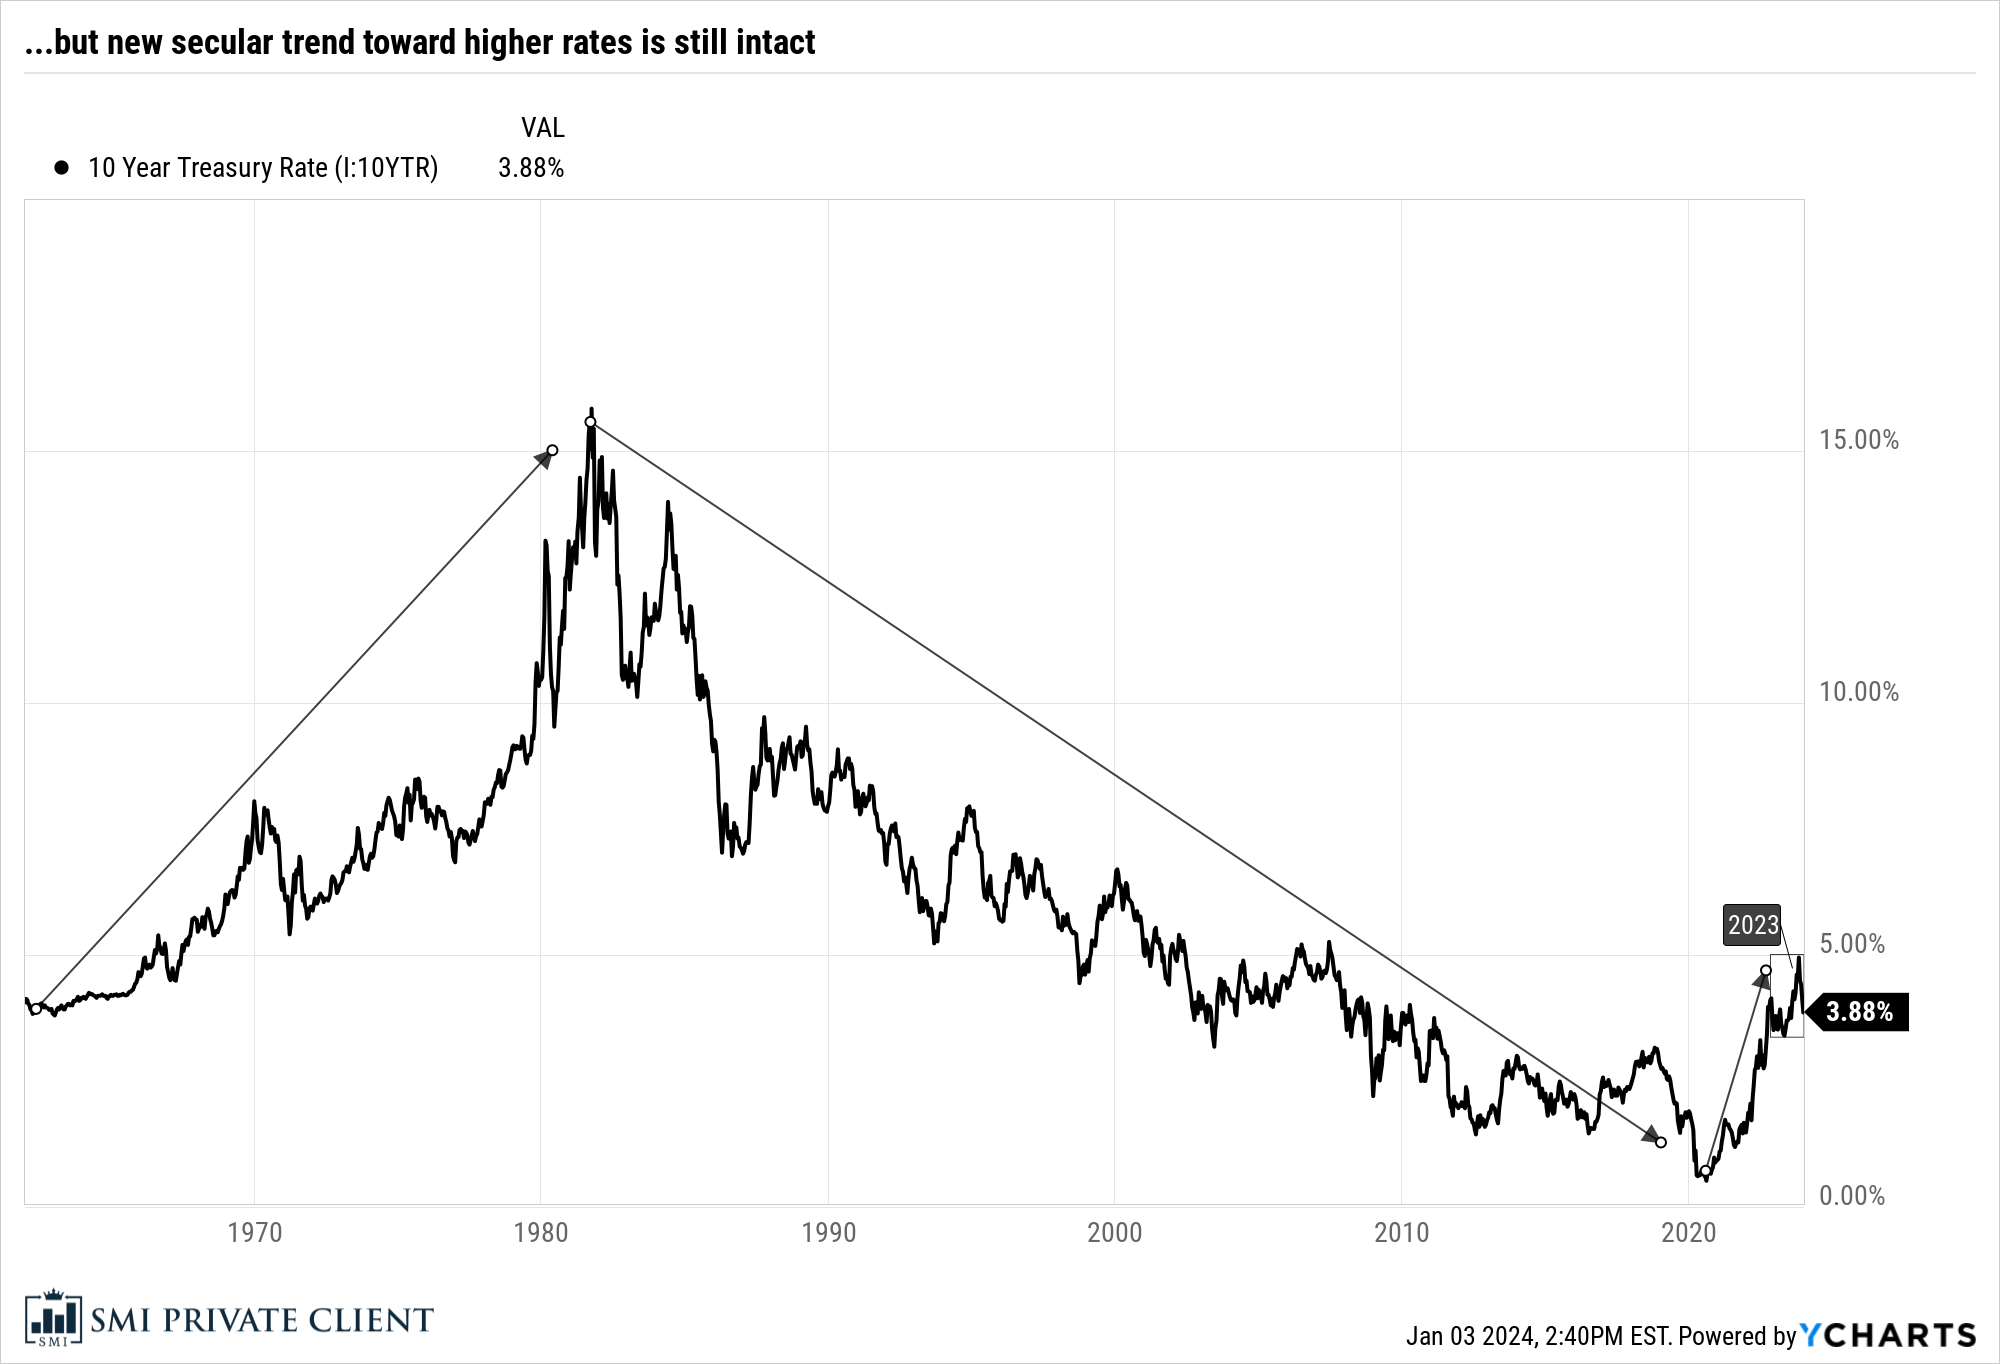 See the tiny little box in the bottom right corner? That's last year. Pretty insignificant in the broader secular scheme of interest rate moves. Yet powerful enough to still whip investors around pretty good throughout 2023.
The biggest takeaway from these charts, as well as perhaps the January cover article, is that once these interest-rate regimes shift, they tend to persist in the new direction for a long time — decades. It's too early to say definitively that this is the case, but that's what we're watching for.
Generally speaking, rising rate environments are much more challenging for investors than falling rate regimes. But they're also times when good active strategies are more likely to outperform. Images used with permission.Related Articles

May 25, 2025
How To Choose The Right Financial Advisor
For Christians who want their finances to reflect their faith, it’s about more than just numbers and returns....

April 13, 2025
Time for Foreign Stocks to Shine?
Have stocks shifted in a different Direction? Recent pickup in foreign returns has certainly grabbed our attention....

March 18, 2025