Inflation: Not Dead Yet
What are the bottom line implications of inflation reports that we regularly hear? What's a rational perspective?

As is often the case with these reports, the details painted a rather different picture than the headline. Rather than a picture of inflation being increasingly tamed against a backdrop of still-solid economic growth (the combination of which has boosted asset prices dramatically over the past three months), yesterday's report presented a stark interruption in that narrative — and markets responded accordingly.
The first problem was the monthly increase in January inflation, which came in at 0.3%. That's not terrible, but it was higher than expected. More importantly, that meant that since bottoming at 0.1% in October, the last three monthly prints have now been 0.2%, 0.2%, and 0.3%. On a month-over-month basis, inflation is now moving in the wrong direction. When markets are priced for perfection, surprises and disappointments can cause big adjustments.
Digging deeper, we find it's not just the past month that is concerning. SMI Upgraders will understand the following analogy. If we own a fund where the 12-month momentum still looks good, but the 3-month and 6-month numbers are trending the wrong way, we naturally start getting nervous because the more recent data is looking worse. That's the way to think of yesterday's inflation numbers. The 12-month CPI number declined from 3.4% to 3.1% (which is good in this case, as investors want declining inflation). But the annualized 3-month rate went from 3.3% last month to 4.0% this month, while the 6-month went from 3.2% to 3.7%. These are the breaks in the trend of declining inflation that have investors suddenly nervous.
CPI variants The second problem stems from the "CPI variations" that are included in each monthly report. The chart below (from Bloomberg via Tommy Thornton of HedgeFund Telemetry) shows two of these variants.First, in the top panel, we can see the three-month rise in "headline" monthly CPI. It actually makes the point better than my rounded numbers earlier, as it shows the increase each month since October.
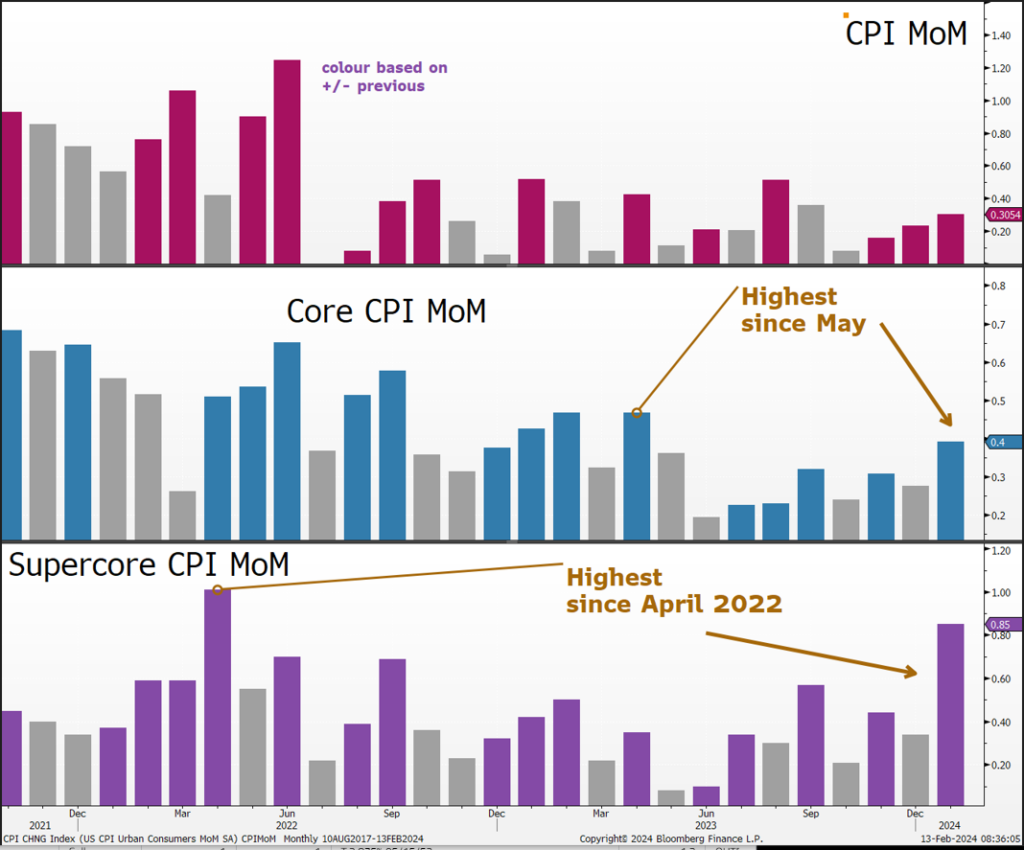
The second panel shows "Core CPI" — that's inflation with food and energy stripped out. While we all obviously rely heavily on those two categories, they tend to be "noisy" (primarily because energy prices move around so much). So, in theory, this gives us a better view of inflation in the "rest of the economy." Whatever its actual value, the Fed pays attention to it, so it's important in that context. The second panel shows clearly that this measure of inflation bottomed way back in June of last year and has been gradually trending higher since, with a big jump higher in January.
The bottom panel shows "Super Core CPI," which the Fed has been putting particularly high emphasis on over the past year or so. This variant focuses specifically on "services" inflation, minus housing and energy. Without getting lost in the weeds here, the reason for this emphasis is service costs are primarily made up of wages, and it's wage inflation that the Fed has been so nervous about getting out of hand. The bottom panel shows the same general increasing trend since last summer along with a big spike in January.
Inflation data is noisy, but...We always want to be careful about putting too much weight on one report. The graphic above shows how these numbers can bounce around quite a bit from month to month. But this report hit hard because of both market positioning and the trend in other recent data.
First, positioning. The "goldilocks" environment of falling inflation without significant economic slowing is largely responsible for the huge gains in stocks and bonds since the October lows. At the start of 2024, these trends had market participants so optimistic that Fed Funds futures were predicting seven rate cuts, despite the number of investors expecting a recession falling dramatically. This was the ultimate "soft landing" scenario — so soft investors thought they'd get no recession plus a fistful of rate cuts!That always struck us as way too optimistic. The only way that was going to happen was if inflation kept coming down perfectly to the Fed's 2% annual target while economic growth continued to slow — but not too much!
Lately, we've seen a bevy of economic indicators coming in stronger, suggesting the slowing economy may have bottomed out and started strengthening. It's too early to say that is for sure the case. There is a certain cadre who maintain these signs of strength are a mirage and the real underlying weakness will become apparent in the months ahead. But taking the data at face value, there's plenty to suggest the economy may have bottomed and then started rebounding slightly in January.
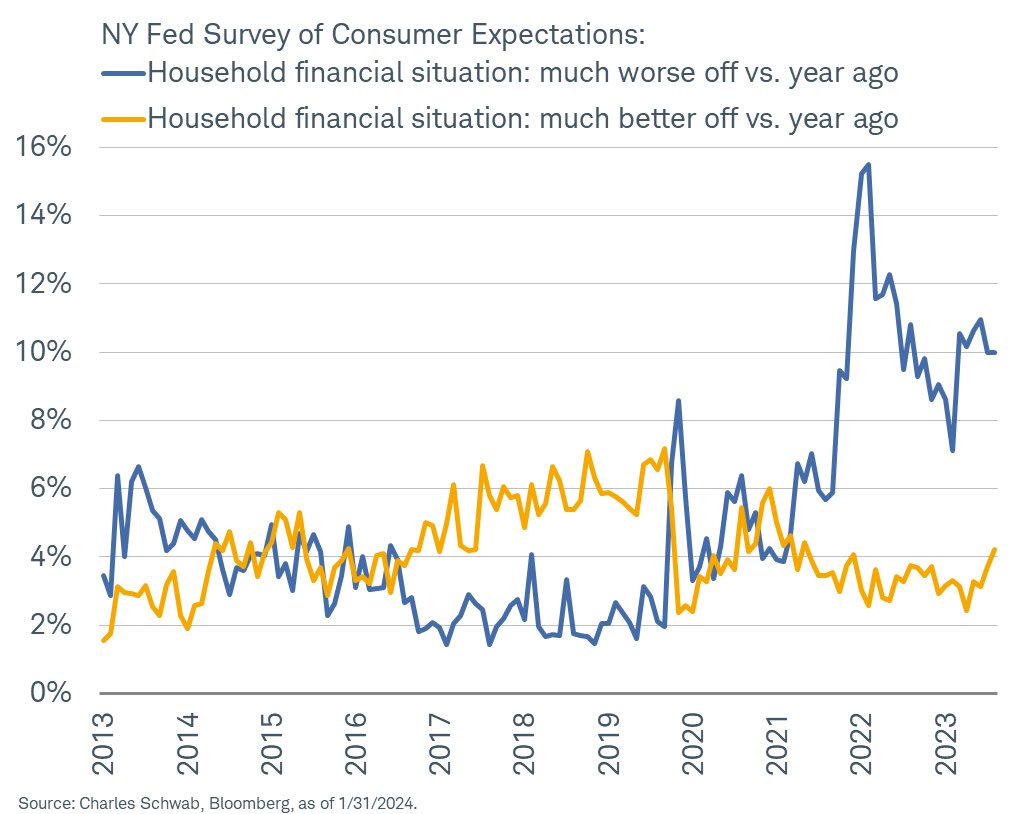
Here are a few examples. First up, the percentage of households saying things are better than one year ago is ticking higher, while the percentage saying worse than a year ago has started declining.
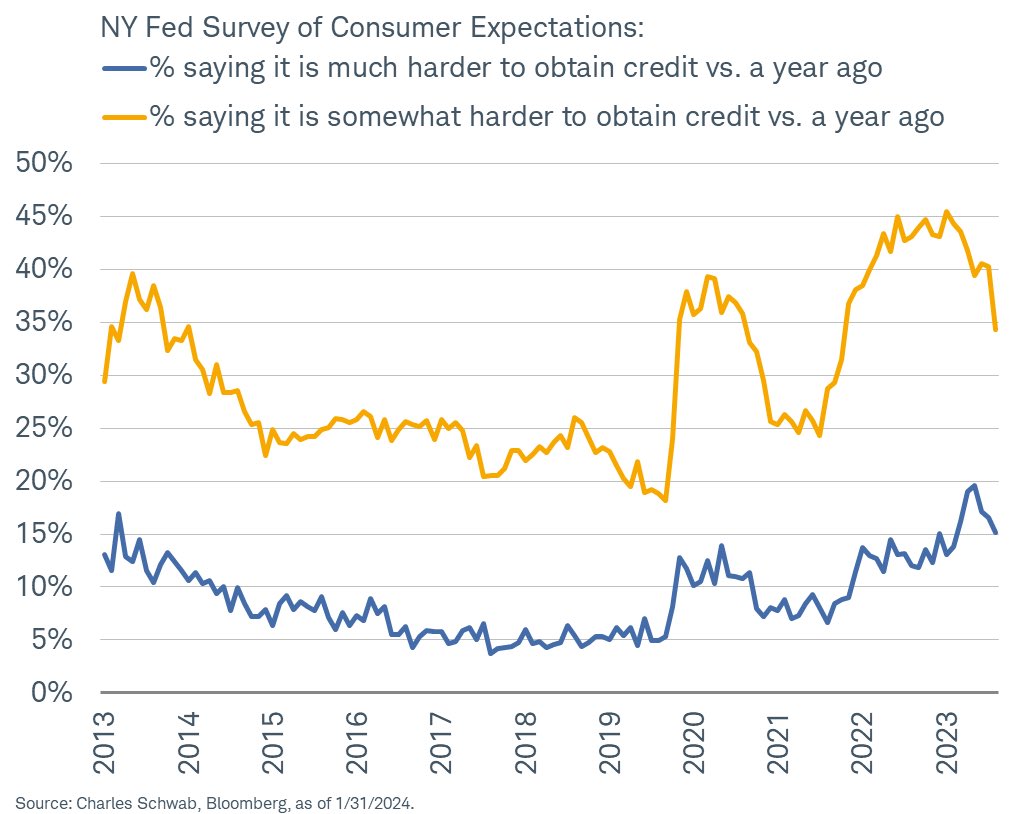
Consumers are reporting a much easier time obtaining credit:
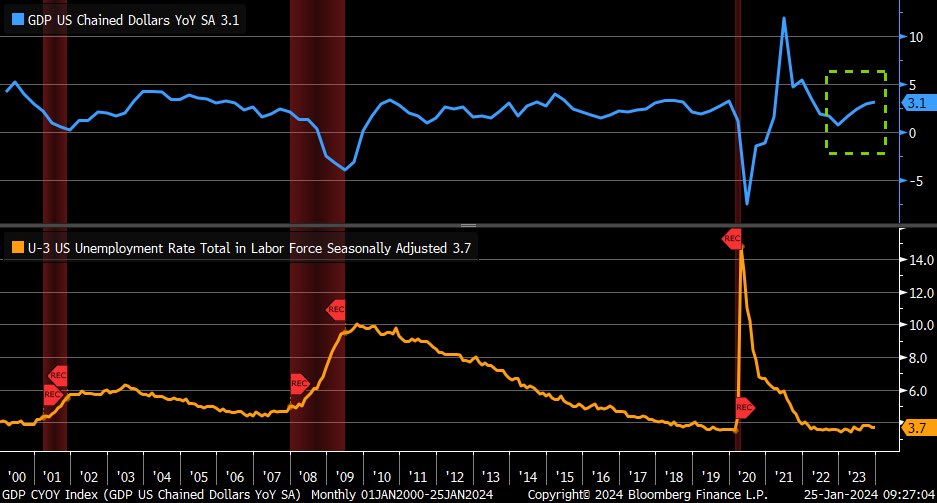
Cutting to the heart of the matter, economic growth appears to have potentially turned higher, while employment numbers continue to look solid.
 Implications
Let's bottom-line this. The combination of slowing (but not too much) growth and falling inflation was largely responsible for the "goldilocks" investment climate that boosted stocks dramatically in recent months while interest rates remained largely in check. But now we see growth accelerating a bit and, right on cue, inflation revving back higher as well.
That, unfortunately, has the potential to upset the delicate apple cart markets have been enjoying the past three months. After peaking at 5.0% in October, the 10-year Treasury yield declined all the way to 3.8% by late December, providing the tailwind for the phenomenal year-end stock market rally. As recently as Feb. 1, that rate was still just 3.88%. As economic growth started to strengthen in data releases over the past two weeks, that rate had risen to 4.15%. And when today's CPI numbers were released, it spiked from 4.15% to 4.32%.
Bonds sold off (of course), and stocks hated it too, with small caps (Russell 2000) down -4.0% yesterday. As we've seen repeatedly over the past two years, when interest rates rise significantly, the stock market tends to sell off. We saw it in the first 10 months of 2022 and again last summer as yields rose. After having a bunch of rate cuts priced into markets coming into 2024, investors are quickly re-assessing the landscape. After all, if growth is picking back up and driving inflation with it, the chances of the Fed cutting at all, much less numerous times, seems much less likely.To summarize, this post isn't to say inflation is suddenly soaring again. It isn't. But yesterday's report indicates inflation remains sticky, and the path to the Fed's 2% target is likely to be difficult. That's the narrative shift, which definitely isn't supportive of the 5-7 rate cuts in 2024 that investors had optimistically envisioned (and priced in) over the past few months.
We'll continue this examination in the March issue of SMI, where we'll discuss the implications for bonds specifically and what investors' options are if they're concerned about rates continuing to rise. Images used with permission.Related Articles

May 25, 2025
How To Choose The Right Financial Advisor
For Christians who want their finances to reflect their faith, it’s about more than just numbers and returns....

April 13, 2025
Time for Foreign Stocks to Shine?
Have stocks shifted in a different Direction? Recent pickup in foreign returns has certainly grabbed our attention....

March 18, 2025